How a $15 Federal Minimum Wage Could Harm Businesses, Workers, and Consumers in Lower-Income Cities
The recent debate over an increase in the federal minimum wage to $15 from its current level of $7.25 has brought public attention to an ongoing debate within the economics community over the impacts of minimum wages generally. Some studies indicate that minimum wage increases have impacts that are more muted than economic theory might predict. Other studies indicate that employment of low-skilled workers suffer and those types of job opportunities become more scarce as a result of a minimum wage. Still others indicate that those who are currently employed at minimum wage may not necessarily lose their job but employers may instead raise the prices of the goods and services they sell to customers or reduce the hours in a worker’s shift or both. (A good summary published by the National Bureau of Economic Research of the recent peer-reviewed literature on these questions co-authored by economists David Neumark and Peter Shirley, is available here.)
An important implicit assumption among economists is that, regardless of the magnitude of the impacts on workers or businesses or consumers or a combination thereof, there will likely be some sort of response from an employer. It is a policy with costs but those costs may be borne by different people in different places in different ways. The extent of the impact and on whom the costs fall is likely to be substantially influenced by the cost of living in a city: $15 is quite a bit more money in cities with a lower cost of living than it is in higher cost areas. In other words, a $15 minimum wage would have a bigger negative impact in a city like Birmingham than the much smaller impact it would have in Boston. The ability of a business owner to pass the cost of a mandated wage increase onto a consumer may be limited in lower-cost markets, for instance. Meanwhile, a mandated wage floor that still doesn’t reach as high as the average wage in a higher-cost market may see fewer of the employment effects that a low-cost market would see.
These impacts are especially consequential to small- and medium-sized businesses in those cities that are already paying average local-market wages. A large increase in mandated wages beyond the local norm would have an outsized impact on those employers in those lower-cost cities, forcing them to make hard decisions about laying off workers, reducing paid hours, automating parts of their operation, or raising prices.
To compare the differential impacts that a $15 federal minimum wage increase could have on average by city, a look at local income levels can be instructive. Local income can serve as a proxy for the local cost of living and also encompass general attributes of a local economic environment. The Center for the Study of Economic Liberty’s annual Doing Business North America report (DBNA) measures city and state minimum wages as a percentage of local income per capita in over 80 U.S. cities as part of its analysis of the ease of doing business in each of those cities. This measure illustrates the difference in each city’s economic capacity to sustain the hit of a one-size-fits-all increase in the federal minimum wage.
The map below shows the U.S. cities that are included in the DBNA 2020 edition. Each city is marked by a colored dot that indicates how far above or below the average hourly income in that city (as measured by per capita income for that city in 2020) is from the proposed $15 minimum wage. Cities in shades of red are those in which the proposed minimum wage will be over 100% of the average hourly per capita income. Cities in shades of green are those in which a $15 minimum wage is below 100% of average hourly per capita income.
$15 Minimum Wage as Percentage of Local Per Capita Income
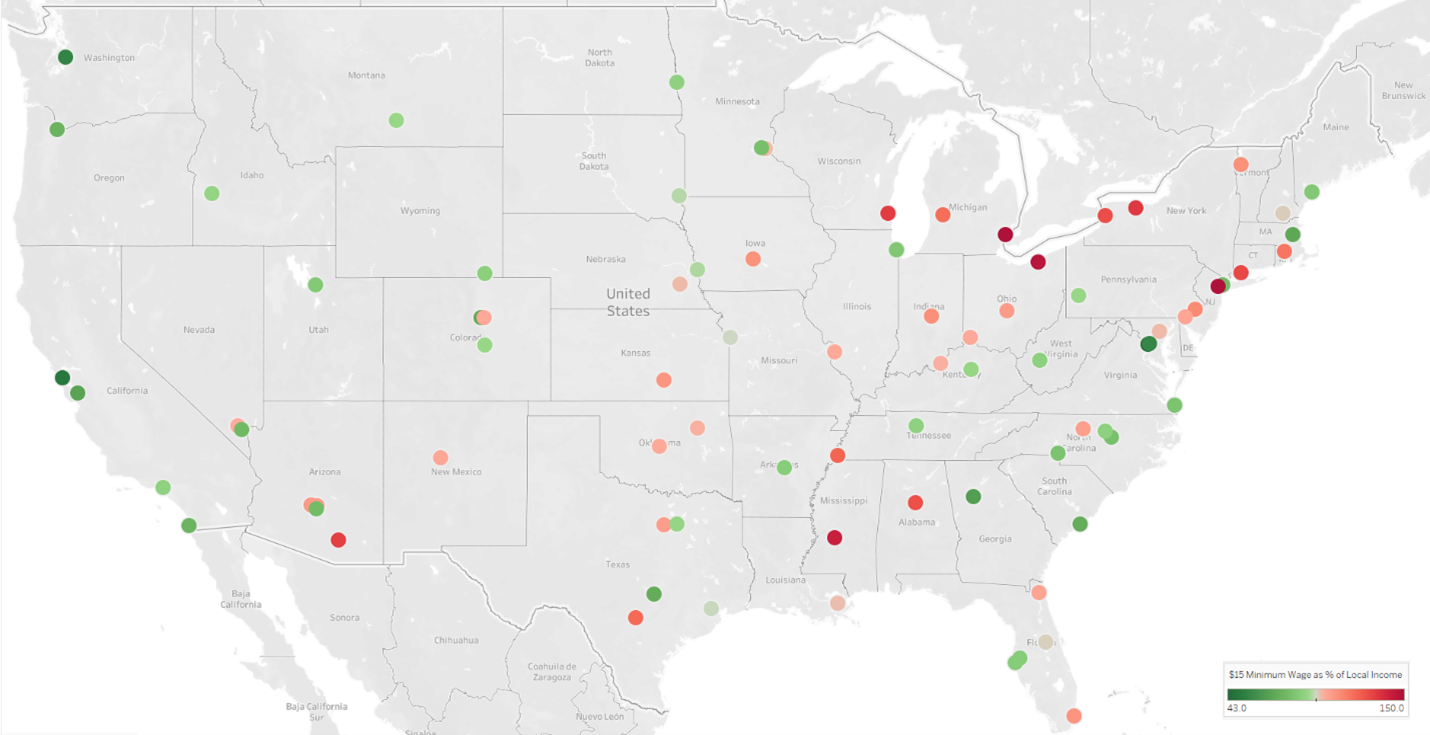
It’s important to remember that states and cities have the power to raise the minimum wage beyond the federal floor and a handful already have. Many of the cities in green are already at a minimum wage of $10 or more due to city-level or statewide law changes that increased the minimum wage above the federal floor. Indeed, five of the cities - Los Angeles, New York, San Francisco, San Jose, and Seattle - are already at a $15 minimum wage and each of them are marked on the map with a green dot because their average hourly per capita income is already so high that a $15 minimum wage doesn’t equal more than 100% of local average hourly per capita income.
Meanwhile, the remaining cities in red will see substantial strains as a result of mandating hourly wages much higher than the local average. Currently, only 5 cities - Bridgeport, Buffalo, Newark, Rochester, and Tucson - have an average local hourly per-capita income level that is right at or below the minimum wage for their state. (The reason is that all of those cities already have a minimum wage in state or local law - in a range of between $11 and $14 - that is higher than the current federal minimum wage.) Under a federal $15 minimum wage, the number of cities in which the mandated minimum equals 100% or more of local average hourly income would climb to 38 cities. Magnitudes of this amount are likely to require compensating cost-cutting or price-raising behavior by businesses that wouldn’t necessarily need to occur in cities that already have high per capita incomes. This is particularly true of businesses with an employee base composed of younger workers with less work experience.
Data Table: $15 Minimum Wage as a Percentage of Per Capita Local Income
| State | City | Percentage |
|---|---|---|
| Alabama | Birmingham | 127% |
| Alaska | Anchorage | 75% |
| Arizona | Chandler | 79% |
| Arizona | Mesa | 106% |
| Arizona | Phoenix | 106% |
| Arizona | Tucson | 132% |
| Arkansas | Little Rock | 87% |
| California | Los Angeles | 88% |
| California | San Diego | 76% |
| California | San Francisco | 49% |
| California | San Jose | 68% |
| Colorado | Aurora | 102% |
| Colorado | Colorado Springs | 92% |
| Colorado | Denver | 71% |
| Connecticut | Bridgeport | 130% |
| Delaware | Wilmington | 103% |
| District of Columbia | Washington | 56% |
| Florida | Jacksonville | 104% |
| Florida | Miami | 108% |
| Florida | Orlando | 97% |
| Florida | St. Petersburg | 86% |
| Florida | Tampa | 86% |
| Georgia | Atlanta | 66% |
| Hawaii | Honolulu | 85% |
| Idaho | Boise | 90% |
| Illinois | Chicago | 84% |
| Indiana | Indianapolis | 110% |
| Iowa | Des Moines | 109% |
| Kansas | Wichita | 108% |
| Kentucky | Lexington | 91% |
| Kentucky | Louisville | 101% |
| Louisiana | New Orleans | 99% |
| Maine | Portland | 84% |
| Maryland | Baltimore | 100% |
| Massachusetts | Boston | 70% |
| Michigan | Detroit | 168% |
| Michigan | Grand Rapids | 119% |
| Minnesota | Minneapolis | 80% |
| Minnesota | St. Paul | 100% |
| Mississippi | Jackson | 142% |
| Missouri | Kansas City | 96% |
| Missouri | St. Louis | 102% |
| Montana | Billings | 91% |
| Nebraska | Lincoln | 100% |
| Nebraska | Omaha | 93% |
| Nevada | Henderson | 78% |
| Nevada | Las Vegas | 101% |
| New Hampshire | Manchester | 98% |
| New Jersey | Newark | 155% |
| New Mexico | Albuquerque | 103% |
| New York | Buffalo | 128% |
| New York | New York City | 78% |
| New York | Rochester | 134% |
| North Carolina | Charlotte | 82% |
| North Carolina | Durham | 88% |
| North Carolina | Greensboro | 105% |
| North Carolina | Raleigh | 81% |
| North Dakota | Fargo | 89% |
| Ohio | Cincinnati | 102% |
| Ohio | Cleveland | 147% |
| Ohio | Columbus | 106% |
| Oklahoma | Oklahoma City | 102% |
| Oklahoma | Tulsa | 101% |
| Oregon | Portland | 76% |
| Pennsylvania | Philadelphia | 112% |
| Pennsylvania | Pittsburgh | 92% |
| Rhode Island | Providence | 117% |
| South Carolina | Charleston | 73% |
| South Dakota | Sioux Falls | 94% |
| Tennessee | Memphis | 122% |
| Tennessee | Nashville | 89% |
| Texas | Austin | 72% |
| Texas | Dallas | 90% |
| Texas | Fort Worth | 106% |
| Texas | Houston | 96% |
| Texas | San Antonio | 120% |
| Utah | Salt Lake City | 85% |
| Vermont | Burlington | 110% |
| Virginia | Arlington | 43% |
| Virginia | Virginia Beach | 83% |
| Washington | Seattle | 55% |
| West Virginia | Charleston | 88% |
| Wisconsin | Milwaukee | 133% |
| Wyoming | Cheyenne | 88% |