Jobless Benefits and Cities: How Federal Unemployment Payouts Can Influence the Return to Work
The spread of COVID-19 and the resulting shutdown of large swaths of the U.S. economy led to large increases in unemployment. State unemployment insurance programs (UI) - designed for the purpose of providing support for the jobless in normal economic recessions - were overwhelmed by the larger-than-usual increase in unemployment claims. How the federal government reacted - and the differential amounts of income-replacement that flow to jobless individuals as a result - can have deep implications for the pace of economic recovery in 2021.
The federal government provided large amounts of support for the state UI programs and funded additional jobless benefits starting in March 2020. The current version of the federal assistance originated in December 2020 with the re-authorization of the Federal Pandemic Unemployment Compensation program (FPUC) which funds a $300 weekly jobless payment on top of any existing state allotment. That assistance was again reauthorized in March 2021 and extended through September.
There is substantial variation between states in terms of UI payments. State law defines the benefits formula as well as the maximum allowable weekly benefit that a UI recipient can receive. By contrast, the federal government's augmentation to those payouts is a flat $300 each week.
Even though the federal payments are a fixed amount, not all cities have a uniform level of per capita income or cost of living or local wage rate. So, a uniform amount of the federal government’s cash transfer means that it could substitute for a larger share of earnings in low-income cities but a smaller share of earnings in high-income cities.
An unemployed worker in any of these cities must decide whether they want to take a job and return to the labor force or continue to receive unemployment benefits. The combined generosity of both the federal and the state UI benefits will certainly enter into their calculus, particularly if those combined benefits are quite generous when compared to average wages in a city, which can sometimes be in excess of a 100% replacement of that wage.
As a result, any effect that the combined federal and state unemployment assistance may have on the persistently high unemployment rate by altering the timing of someone’s decision to return to the workforce will vary depending on whether the sum of both the state UI benefit and the federal assistance equals more than their potential earnings. And because individuals will put a different subjective dollar amount on available leisure time, even unemployment benefits that don’t restore a full 100% of earnings could still entice someone to decline employment in the short-term.
Using data from the Center for the Study of Economic Liberty’s Doing Business North America report - based on Census Bureau estimates – and data from the U.S. Department of Labor on enacted state maximum payout limits allows us to calculate the percentage of weekly income that the maximum potential UI benefits (state and federal combined) replaces in 84 U.S. cities. Note that these ratios are calculated on the total maximum allowable payment. Some UI weekly payouts could be lower depending on their individual wage and prior job status.
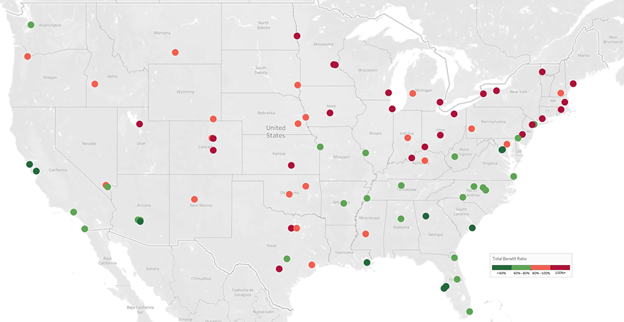
The map and table below shows the combined maximum state plus federal UI benefit as a percentage of average weekly worker income. On the map, the dots correspond to the general level of benefit paid out: the darkest reds dots indicate a payout that is over 100% of the average weekly income per worker for that city as of January 2021. Dots that are lighter red are 80% to 99% of average weekly income per worker. The green dots are 80% and below.
Unemployment Benefit Ratio by City
It’s important to note that the denominator in our estimate of weekly income is the number of people in a city’s population who are 16 years of age or older. That is a conventional measure of the working-age population. Using this measure helps us more closely approximate the average weekly income amount for that city. An overall per capita figure would include in the mix a substantial share of people in the population (over 30% on average) who would not be in the labor force (i.e., those under 16 years of age). Hence the use of the phrase "per worker."
Over half of all the cities on this map have benefit ratios that are above 80% of per worker average weekly income. There are seventeen cities for which the combined maximum federal and state unemployment payouts exceed 100%. Twenty-seven cities see a payout ratio of between 80% and 99%.
Most of the share of these payments come from the traditional state-based UI system. For those top seventeen cities, state UI programs account for 81-percentage points of the total. The federal allotment, however, is what boosts the overall ratio to equal or exceed 100% in those cases. Furthermore, there are a number of states in which the $300 weekly federal allotment more than doubles the overall unemployment benefit for which someone would normally qualify. Alabama, Arizona, Florida, Louisiana, Mississippi and Tennessee all have statutory maximum weekly payouts of less than $300.
Policymakers are already starting to be sensitive to the potential that employers are having trouble finding applicants for job openings due to the generous federal add-on payment. Over twenty states have already officially begun the process of withdrawing from the FPUC program.
Taking into account the variation in how a fixed transfer of $300 from the federal government (which is not adjusted for local economic conditions) could substitute income to different degrees in different places for different workers can help economists discover how much impact this federal policy might have in prolonging the bought of post-pandemic unemployment. Federal data to be released in the coming months, when analyzed in conjunction with the sort of data published here, can help researchers better understand the impact of this policy on local labor markets.
Total Unemployment Benefits (state and federal) as a Percent of Per Worker Personal Income (by City)
| City | State | Total Benefit Ratio |
|---|---|---|
| Albuquerque | New Mexico | 90.83% |
| Anchorage | Alaska | 57.63% |
| Arlington | Virginia | 37.84% |
| Atlanta | Georgia | 47.83% |
| Aurora | Colorado | 115.35% |
| Austin | Texas | 74.45% |
| Baltimore | Maryland | 75.02% |
| Billings | Montana | 89.69% |
| Birmingham | Alabama | 73.53% |
| Boise | Idaho | 78.24% |
| Boston | Massachusetts | 128.30% |
| Bridgeport | Connecticut | 147.79% |
| Buffalo | New York | 102.46% |
| Burlington | Vermont | 99.53% |
| Chandler | Arizona | 50.45% |
| Charleston | West Virginia | 61.02% |
| Charleston | South Carolina | 50.45% |
| Charlotte | North Carolina | 63.69% |
| Cheyenne | Wyoming | 77.98% |
| Chicago | Illinois | 93.10% |
| Cincinnati | Ohio | 109.26% |
| Cleveland | Ohio | 140.75% |
| Colorado Springs | Colorado | 93.70% |
| Columbus | Ohio | 121.70% |
| Dallas | Texas | 86.26% |
| Denver | Colorado | 81.40% |
| Des Moines | Iowa | 115.70% |
| Detroit | Michigan | 90.54% |
| Durham | North Carolina | 66.27% |
| Fargo | North Dakota | 104.55% |
| Fort Worth | Texas | 98.95% |
| Grand Rapids | Michigan | 90.54% |
| Greensboro | North Carolina | 73.35% |
| Henderson | Nevada | 62.62% |
| Honolulu | Hawaii | 81.57% |
| Houston | Texas | 89.72% |
| Indianapolis | Indiana | 84.50% |
| Jackson | Mississippi | 75.31% |
| Jacksonville | Florida | 63.95% |
| Kansas City | Missouri | 68.77% |
| Las Vegas | Nevada | 82.46% |
| Lexington | Kentucky | 88.95% |
| Lincoln | Nebraska | 89.80% |
| Little Rock | Arkansas | 71.34% |
| Los Angeles | California | 73.55% |
| Louisville | Kentucky | 95.07% |
| Manchester | New Hampshire | 82.94% |
| Memphis | Tennessee | 73.92% |
| Mesa | Arizona | 61.11% |
| Miami | Florida | 64.77% |
| Milwaukee | Wisconsin | 95.93% |
| Minneapolis | Minnesota | 105.87% |
| Nashville | Tennessee | 60.75% |
| New Orleans | Louisiana | 55.92% |
| New York City | New York | 66.76% |
| Newark | New Jersey | 162.73% |
| Oklahoma City | Oklahoma | 85.57% |
| Omaha | Nebraska | 82.39% |
| Orlando | Florida | 67.10% |
| Philadelphia | Pennsylvania | 101.05% |
| Phoenix | Arizona | 64.21% |
| Pittsburgh | Pennsylvania | 86.59% |
| Portland | Maine | 98.01% |
| Portland | Oregon | 86.10% |
| Providence | Rhode Island | 125.57% |
| Raleigh | North Carolina | 61.73% |
| Rochester | New York | 112.05% |
| Salt Lake City | Utah | 92.96% |
| San Antonio | Texas | 106.81% |
| San Diego | California | 61.85% |
| San Francisco | California | 40.26% |
| San Jose | California | 57.16% |
| Seattle | Washington | 73.07% |
| Sioux Falls | South Dakota | 84.49% |
| St. Louis | Missouri | 69.56% |
| St. Paul | Minnesota | 124.26% |
| St. Petersburg | Florida | 52.19% |
| Tampa | Florida | 53.73% |
| Tulsa | Oklahoma | 83.69% |
| Tucson | Arizona | 71.82% |
| Virginia Beach | Virginia | 60.10% |
| Washington | District of Columbia | 48.16% |
| Wichita | Kansas | 96.69% |
| Wilmington | Delaware | 74.15% |