The Ease of Doing Business and Growth in Small to Medium-Sized Businesses
When we think of the largest employers in a U.S. city, we often think of the biggest single employers: Wal-Mart, for instance, or a Fortune 500 corporation with a local plant or headquarters.
Small and medium-sized businesses that employ between 1 and 50 employees are far more common. Those firms make up over 90% of the businesses in the average U.S. city, according to U.S. Census data. As a group, they add up to the biggest combined source of private-sector employment in an average city, accounting for over 40% of the total. (The cohort of businesses with 20 to 49 employees alone accounted for 17%. The under-20 businesses accounted for the remaining 24%.)
The number of business starts and size of the business growth in that cohort is essential to economic and employment growth of a city. Some attributes of a city - like the education level of the workforce - may make some cities more favorable environments than others for certain types of business growth. But there are factors that are directly controlled by city-level policymakers and elected officials that can also impact the rate of growth of small and medium-sized businesses by making it either easy or difficult to start or expand a business.
The Doing Business North America report (DBNA) - an annual study from the Center for the Study of Economic Liberty at Arizona State University - attempts to provide a measure of the ease of doing business for cities in North America. The overall Ease of Doing Business score is derived from a summation of the scores awarded in each of six categories.
In other words, this "Ease of Doing Business" measure focuses on the regulatory hurdles a small to medium-sized business would face when starting and operating a business in cities across North America. The cities are then ranked based on their scores from highest to lowest. This score allows us to compare the policy environment of a city to various economic outcomes.
The U.S. Census Bureau's County Business Patterns survey (CBP) is a good place to start this analysis. It tracks the number of business establishments by size in most U.S. cities and metro areas. Comparing them between years allows researchers to see both the overall creation of new firms as well as the expansion in existing firms (for instance, when they grow from 10 employees to 20 employees).
Using the CBP data we can see how the DBNA scores for each city relate to the growth in businesses across a variety of employee-size classes. Furthermore, comparing these metrics to the scores of the DBNA 2019 report allows us to see the correlation between business starts and business expansions in the small and medium-sized business category and the DBNA’s overall “Ease of Doing Business” score.
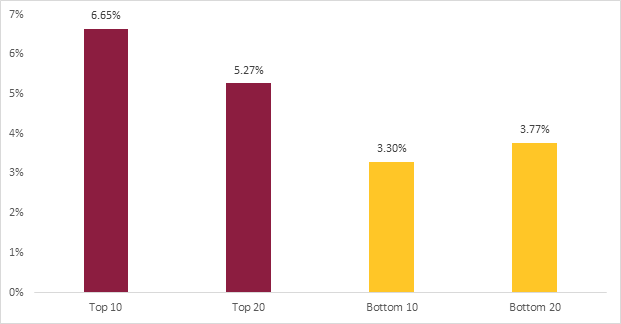
The DBNA scores do seem to be linked positively and substantially to the healthy growth or expansion of small and medium-sized businesses. (See Chart 1.) The 10 U.S. cities with the top “Ease of Doing Business” scores had an average growth rate of businesses with under 50 employees of 6.7% between 2014 and 2017 (the most recent year for which data is available). Meanwhile, the 10 U.S. cities with the lowest “Ease of Doing Business Scores” had an average growth rate of 3.3% - less than half of the top scoring cities - during this same period. This general pattern holds when you expand the analysis to the top 20 and the bottom 20 too.
Chart 1:
Top Scoring U.S. Cities vs. Lowest Scoring U.S. Cities
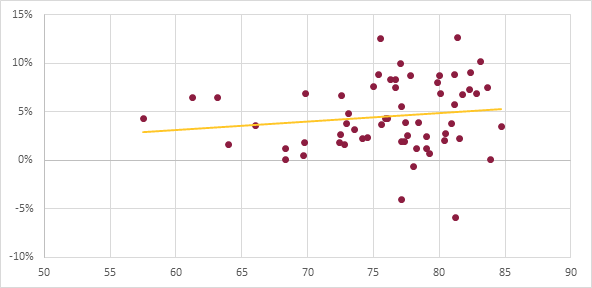
The scatterplot chart (Chart 2) below shows the overall trend. The Ease of Doing Business Score is along the horizontal axis and the growth in small and medium-sized businesses is on the vertical access. (No U.S. city scored less than 50 out of 100 in the DBNA study, so that's where the horizontal axis begins). The trendline shows the overall positive correlation - meaning, the higher a city scores on the Doing Business North America report, the higher the growth rate they are likely to see over this period.
Chart 2:
Ease of Doing Business Score vs. Growth Rate in Small and Medium-Sized Businesses
This may simply be a coincidence. Perhaps larger or wealthier cities have higher scores and higher growth rates anyway. We can test these hypotheses too using some basic statistical analysis. The inclusion of control variables can help us see whether this connection still stands even after adjusting for other factors that might explain the difference between cities.
After controlling specifically for both the total population of the city and the average household income of the city - two very common control factors - the correlation is still positive and, most importantly, statistically significant. (More details are available in the “Regression Results and Methodology Appendix” section below.) That means that a higher DBNA score is associated with a higher small and medium-sized business growth rate even after including in the analysis other factors that may also explain that trend.
That’s not to say that the size or wealth of a city do not play a role. The statistical analysis here indicates it certainly does. But the ease of doing business in a city also plays a factor. It’s those attributes - usually more directly controllable by city officials and mayors - that can play an important role in economic growth at the city level - and, by extension, state and national growth too.
Regression Results and Methodology Appendix
Ordinary least squares regression analysis was used to determine whether the connection between business growth as measured by the U.S. Census County Business Patterns (CBP) data and the overall "Ease of Doing Business" score from the Doing Business North America (DBNA) study is significant.
The dependent variable was the percentage growth in small and medium-sized businesses (defined as those businesses with between 1 to 50 employees) between the years 2014 and 2017, the most recent year for which data are available.
The main independent variable is the Ease of Doing Business score for each U.S. city in the Doing Business North America 2019 report. An explanation of how those scores are calculated can be found here. As noted previously, the score is an attempt to measure how easy it is to set-up and operate a business. The score includes important attributes such as how long the local government-required process to set up a business and how much it costs; how difficult and expensive it is to maintain employees; and even how much it costs to pay for the electricity required to keep the business running.
Two control variables were included in the regression. The first is the average household income for each city from the U.S. Bureau of Economic Analysis. The second is the natural log of the population of each city, as published by the U.S. Census Bureau.
The regression sample consisted of 61 cities. There are 66 U.S. cities in the DBNA 2019 report. The CBP data uses the Census definitions of the metro areas for many of the cities represented in the DBNA. However, some of those metro areas include more than one city on the list of cities in the DBNA. (For instance, the New York City metro area includes New York City as well as Newark, New Jersey, two cities that are scored separately in the DBNA.) There is currently no methodology for aggregating the DBNA scores, and the Census bureau does not provide stand-alone data for most cities within aggregated metro areas in the CBP dataset. That means some cities had to be excluded from this analysis. The cities excluded from the sample were: New York, NY; Newark, NJ; Philadelphia, PA; Wilmington, DE; and Washington, DC. Arlington, VA is included in the Census combined metro area for Washington, DC, but the data for Arlington County (which encompasses the same geographic area as Arlington city) is published separately so it was used in this case. There were some cases where the remaining cities on the DBNA list were within a metro area in the CBP data that also included cities that were not scored in the DBNA. In those cases, however, the DBNA score applied to the dominant city (i.e., was over 50% of the population of the combined metro area).
Regression results are included below. One asterisk indicates statistical significance at the 90th percentile. Two asterisks indicates significance at the 95th percentile. Three asterisks indicate significance at the 99th percentile.
Table 3:
Regression Results
| Coefficient | Sig | Std. Error | |
|---|---|---|---|
| Ease of Doing Business Score | 0.0015 | * | 0.0008 |
| Household Income | 1.26E-07 | 2.9E-07 | |
| Population (ln) | 0.014 | *** | 0.0048 |
| Constant | -0.261 | ** | 0.1028 |
Observations = 61
R-squared: 0.15