The Long View of “The Bet”
In 1980, Paul Ehrlich and Julian Simon agreed to a public bet on what the price of commodities would be 10 years hence. Ehrlich was free to choose the commodities; he chose a basket of copper, chromium, nickel, tin, and tungsten valued at $1000 in 1980. During the 1960s and 1970s, those metals had been trending upward, and had the bet been made twenty years earlier, Ehrlich would have won. Unfortunately for him, in the early 1980s the trend reversed and prices of those commodities collapsed. Simon won, and Ehrlich mailed him a check for $575.07.
Of course, a bigger question was at stake. Ehrlich was deeply pessimistic about humanity’s future because of overpopulation, and had become a household name as an evangelist for environmental conservation and economic doomsaying. Simon argued that innovation in response to changing resource prices would stay ahead of Ehrlich’s curse. For Simon, our minds are what matter in the economic realm, and the more minds, the better the solutions will be. Simon won the bet, but we continue today to hear that our quest for prosperity will end. Was Simon just lucky?
In summer 2020, I asked my former student Jesse Grabowski, a graduate student at University of Paris 1 Panthéon-Sorbonne, to join me in revisiting the Simon-Ehrlich bet. With the tools of quantitative financial analysis, could we re-examine the conclusions drawn from the bets? Could Ehrlich have chosen better? What if they had made the bet a few years earlier, or a few years later? What was the role of pure random chance in the outcome of the bet?
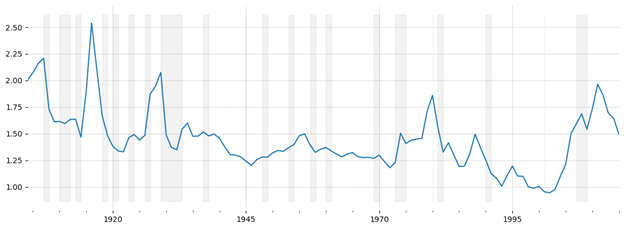
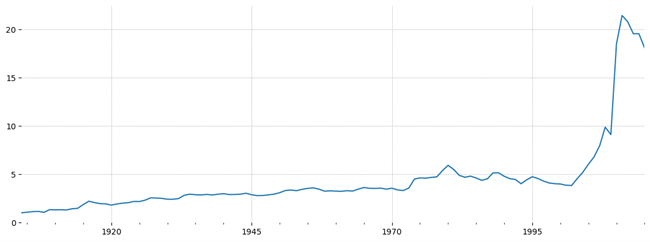
As we point out in a new article released in Ecological Economics (“Better Lucky Than Good”), all of these questions have answers, because bets on the future price of goods happen every day on financial markets all around the world. Could Ehrlich have chosen better? Certainly! He could have chosen to buy more resources — as many as possible. If he was truly convinced prices were going to trend upward, this would have reduced the risk that a chance event in one resource market or another would have caused him to lose the bet. Empirically, was Ehrlich right to be confident about an upward trajectory in resource prices? We computed an inflation-adjusted price index of 41 resources, shown in figure 1. In the 1970s, prices were indeed spiking up, but this appears to be an exception. Overall, prices trended downward throughout the 20th century.
Figure 1: Market Index for 41 Resources, Computed Using Fisher’s Ideal Index with Base Year 1998.
Official NBER Recessions Shaded in Gray
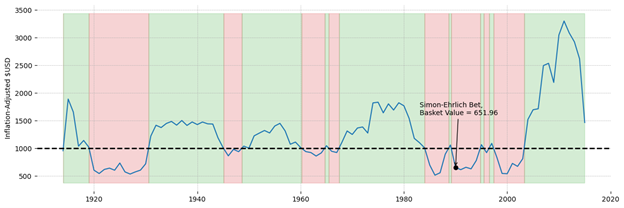
What about the time of the bet? We back-tested Ehrlich’s 10-year buy-and-hold investment strategy over all 10-year windows in our dataset. Despite the overall downward trend in the price index of resources, Ehrlich wins 69 out of 102 of the possible 10-year bets between 1903 and 2015. These results are shown in figure 2. Bets that Ehrlich would have won are shaded in green, while those that Simon would have won are shaded in red.
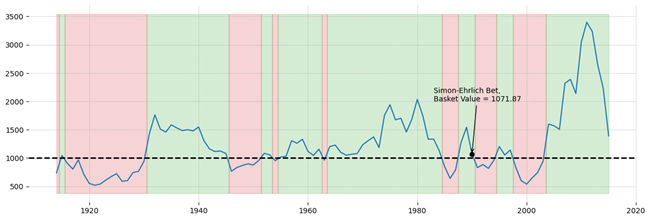
The fact that Ehrlich’s basket would have won the majority of bets, despite losing the 1980–1990 bet, suggests that he did not adequately consider potential downside risk when constructing his portfolio. In choosing his portfolio, Ehrlich revealed some information about his risk tolerance. Between 1950 and 1975, approximately the period to which Ehrlich referred when selecting resources for the bet, returns on his basket of resources varied by about 11%. This gives us some insight into what kinds of risk Ehrlich was willing to tolerate. Holding this risk tolerance constant, we found the resource basket that gave the best possible return in the calibration period was comprised of 34% nickel, 32% chromium, 11% pumice and pumicite, 10% antimony, and about 5% in each of silver, mercury, and gold. Figure 3 shows our back-tested results for this portfolio. It performs about as well as Ehrlich’s, winning 65 out of 102 of the 10-year bets, but just barely winning the bet against Simon from 1980 to 1990. Evidently, by consulting a financial advisor, Ehrlich could have managed at least a draw!
Figure 3: Final Value of a $1000 Investment in the Markowitz Efficient Portfolio with standard deviation of 11% after 10 Years, Calibrated 1950-1975, Inflation Adjusted
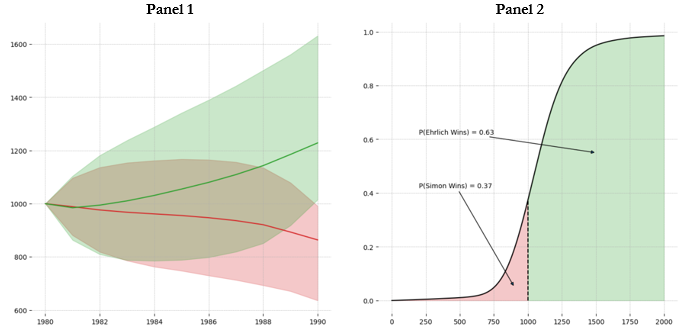
Finally, to test the role of random chance in the bet, we ran Monte Carlo simulations of the 1980–1990 bet. Using a model of resource prices, we simulated thousands of possible bets, the result of each determined by random fluctuations around our estimated long-run mean of the prices of chromium, copper, nickel, tin, and tungsten. Based on our models of resource prices, Ehrlich is expected to win the 1980–1990 bet 63 out of 100 times — about the same win rate we observed in historical back-testing. Figure 4 shows the results. Once again, despite the trend we see in the market index, Ehrlich is the favorite to win. Simon’s win was due in large part to the collapse in the prices of tin and tungsten.
Simon won the bet, and we also see a downward trend in the price index of resources. But we have also seen that had Ehrlich modified his strategy, or been a bit luckier in the 1980s, he could have won the bet. What, then, does the bet say about the threat of collapse, or the power of markets to allocate scarce resources and spur needed innovation? Perhaps nothing! After all, although bets on the future of resource prices are carried out every day on financial markets around the world, these authors have never heard of an economist or ecologist of any stripe pointing to the rising or falling stock price of a mining company as evidence of either boom or doom.
Although the bet might ultimately have little to say about the future of resource prices, there is one more lesson the resource price data might teach us. If Simon is right, and if markets signal the need for the development of new technology via high prices, we should observe a pattern of mean-reversion in prices. Prices should go up or down temporarily, in response to external factors like new deposit discoveries, new technologies, wars, or news of mine exhaustions. These prices should then set the system of innovation into motion. This could lead producers to develop new production processes that use cheaper alternatives, or reduce the quantity of now-expensive resource needed. Equally, it might impel mine owners to extract more resources, or invest in finding new deposits. On net, the predicted result is that prices should slowly fall back to their long-term average, rather than staying permanently high.
Figure 4: Monte Carlo Simulation of the Simon-Ehrlich Bet
Panel 1 shows, in each year, the average simulated portfolio value for portfolios that ultimately result in Simon winning (in red) or Ehrlich winning (in green). Panel 2 shows the cumulative probability of each final portfolio value, shaded by the region where either Simon or Ehrlich wins the bet.
We tested whether prices of 43 resources exhibit the behavior predicted by this theory, and found evidence of mean reversion in 33. In general, therefore, resource prices tend to vary around a long-run average, but always come back to it. In 24 cases, this long-run average is either flat or decreasing. In 15 cases the long-run average is either increasing, or the prices do not appear to be mean-reverting. Given that resource prices appear to conform to the prediction of the market theory, we propose an alternative bet. Buy all 43 resources in equal, 2.3%, shares. At the end of every year, sell winners and buy losers to re-balance the portfolio back to equal 2.3% shares. Following this strategy, an investor would have increased his inflation-adjusted wealth by 1,800% over a 100-year period. Clearly, if one is going to bet, bet on the power of the market!
Figure 5: Portfolio Value of Following a Contrarian Resource Investment Strategy
Portfolio is constructed by holding an equal share, 2.3%, in each resource at the start of every year. At the end of every year, the investor sells winners and buys losers to re-balance back to 2.3%
This editorial is based on the article published in Ecological Economics, Volume 193, Ross B. Emmett, Jesse Grabowski, Better lucky than good: The Simon-Ehrlich bet through the lens of financial economics, Copyright © 2022 Elsevier B.V. All rights reserved.